Viscovery showcases

The application demos presented here use data and results from real-life applications or from publicly available sources to give you a quick introduction to Viscovery software and its different uses. To view the demos, please ensure that you have JavaScript enabled in your browser.

General notice on data privacy: Application demos based on external sources that include confidential data have been altered where necessary to ensure data privacy.

Go To Website Visitors Demo

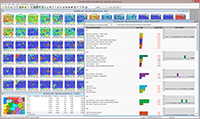
Website visitors

Using click data recorded for website visitors, cluster analysis is performed and user profiles are created for real-time classification of the current visitor based on click behavior.

Go to the website visitors demo


Go To Snow Crystal Demo

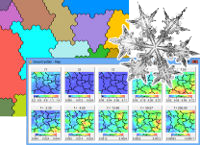
Snow crystal images

Using a historical archive of snow crystals micrographs, an ordered map of crystal types is created. Photographic elements are ordered based on intermediate image processing to determine similarity and can be accessed interactively by the user.

Go to the snow crystal images demo


Go To Music-styles Demo

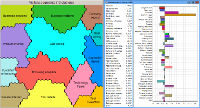
Test your own music style

Using responses to a questionnaire about social demographic variables and hobbies, including music preferences, a SOM was generated, which was used to display music interests over the generated clusters. Locate your own profile in the map!

Go to the music styles demo


Go To Big Data Visualization Demo

Big Data visualization

Using a dataset of 22.5 million death records from the United States, we show how Big Data can be quickly visualized and analyzed with Viscovery SOMine.

Go to the Big Data visualization demo