Self-organizing maps
Self-organizing maps (SOMs, also referred to as Kohonen maps) are used to create an ordered representation of multi-dimensional data which simplifies complexity and reveals meaningful relationships. SOMs are a particularly robust form of unsupervised neural networks that, since their introduction by Prof. Teuvo Kohonen in the early 1980s, have been the technological basis of countless applications as well as the subject of many thousands of publications.
Analogy to regression
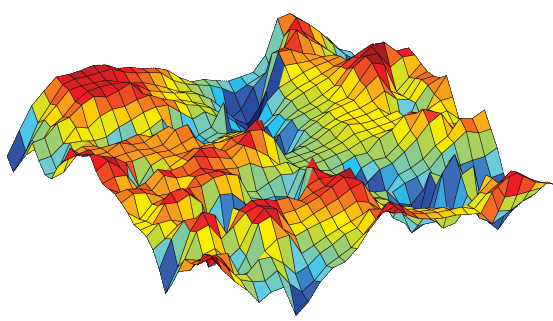
The SOM method can be viewed as a non-parametric regression technique that converts multi-dimensional data spaces into lower dimensional abstractions. Much like a regression plane being an abstraction of the original data, a SOM generates a representation of the data distribution, however, with the crucial difference that this representation is non-linear.
For data mining purposes, it has become a standard to approximate the SOM by a two-dimensional hexagonal grid. The “nodes” on the grid are associated to so-called “reference vectors” which point to distinct regions in the original data space. Starting with sets of numerical, multivariate data, these reference vectors on the grid gradually adapt to the intrinsic shape of the data distribution, whereby the reference vectors of neighbored nodes point to adjacent regions in the data space. Thus the order on the grid reflects the neighborhood within the data, such that data distribution features can be read directly from the emerging landscape on the grid.
This powerful method of data representation is provided by many leading data mining suites on the market. For the Viscovery system, the SOM method is the basis on which a multitude of analytical and statistical techniques are applied. Viscovery systematically combines SOMs with classical statistical methods in an intuitive visual environment that allows anyone to understand the resulting analytical model, regardless of their statistics background: there is no need for familiarity with the basic Kohonen algorithm. In Viscovery, users are shielded from details of the SOM creation process, as they are guided through the application in an environment of well-balanced settings and defaults.
Coaction with other analytical methods
In Viscovery, the data representation contained in the trained SOM is systematically converted for use across a broad spectrum of visualization techniques. When Viscovery is used to evaluate dependences, to investigate properties of the data distribution, to search for clusters, or to monitor new data — just to mention a few options — an intuitive and inspiring interactive process emerges.
In addition to the capabilities for data exploration, Viscovery employs a multitude of statistical techniques for the creation and application of classification and prediction models, all embedded in a workflow-guided project environment. The Viscovery data mining products offer comprehensive technical features for the generation of predictive models, such as scoring models or segmentations, as well as their application and real-time integration into an operational environment.
Much of the theoretical background as well as of innovative algorithms in the field of SOMs is owed to Prof. Kohonen, who, as the former Head of the Laboratory of Computer and Information Science at the Helsinki University of Technology, prominently contributed to the creation, evolution, and spread of SOM technology. As the originator of several new concepts, Prof. Kohonen is the author of hundreds of scientific papers as well as of several text books, among them the standard lecture book on “Self-Organizing Maps”. His manifold contributions to scientific progress have been multiply awarded and honored.
Learn more about features and benefits of, and solutions using, Viscovery software.